
Maria Topal
Moldova
Peculiarities of body composition of patients with type 2 diabetes
Maria Topal, Lorina Vudu
1. Deapartment of Endocrinology, Nicolae Testemitanu State University of Medicine and Pharmacy , Chisinau, Moldova.
2. Timofei Mosneaga Republican Clinical Hospital, Chisinau, Moldova.
Abstract
Background
In type 2 diabetes mellitus ( T2 DM), there is insulin resistance and oxidative stress, which are the basis for a decrease in muscle mass due to vascular changes, chronic inflammation and lipid infiltration of muscles. Obesity and sarcopenia associated with type 2 diabetes can cause a decrease in the quality of life and can cause disability of patients. Early diagnosis of these complications can be performed by a non-invasive and affordable method of studying body composition – bioimpedance.
Methods
The study included 100 patients (50 men and 50 women) with T2DM, the average age was 58.4 years with a confirmed diagnosis
of T2DM for at least 1 year , with an average weight of 90.5 kg and 100 control patients with an average age of 58.4 without T2DM and without any other
chronic diseases, with an average of weight 80.87. All the subjects underwent
bioimpedance measurement on the OMRON BF511 Body composition monitor, and
dynamometry with a 5-60 kg WAS WEIR EXPANDER . Screening tests for sarcopenia developed by EWGSOP2
Results
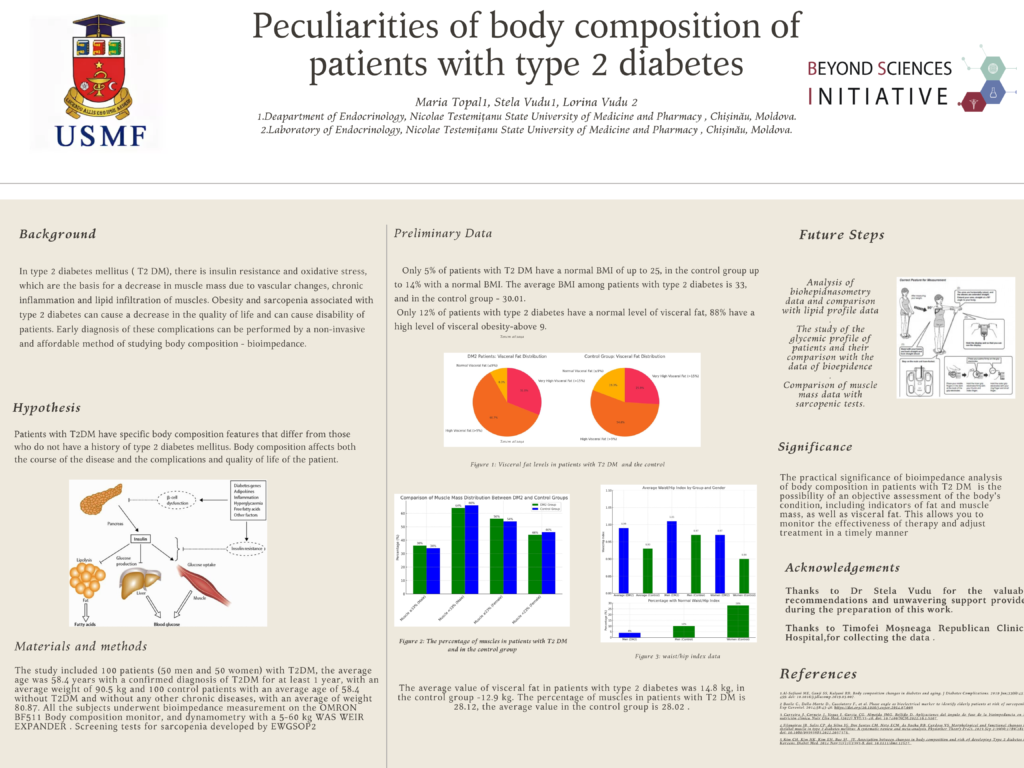
Only 5% of patients with T2 DM have a normal BMI of up to 25, in the control group up to 14% with a normal BMI. The average BMI among patients with type 2 diabetes is 33, and in the control group – 30.01.
The sarcopenic test was positive in 75% of patients with type 2 diabetes, negative in 25%.
Only 12% of patients with type 2 diabetes have a normal level of visceral fat, 88% have a high level of visceral obesity-above 9. In the control group, visceral obesity was detected in 74%. The average value of visceral fat in patients with type 2 diabetes was 14.8 kg, in the control group -12.9 kg.
The percentage of muscles in patients with T2 DM is 28.12, the average value in the control group is 28.02 .
The average glycated hemoglobin in patients with T2 DM is 9%, and the control group has glycemic index of 5.3 mmol/L.
Conclusions
Using Bioimpedance analysis, we identified significant differences
in body composition of the patients with type 2 diabetes and of the control group, which
correlate with both the measurement of patient volumes and the indicators of the lipid and
glycemic profile of patients.
Leave A Comment